

We live in distracting times. An article from the Harvard Business Review says:
To execute a single supply-chain transaction, each person involved switched about 350 times between 22 different applications and unique websites. Over the course of an average day, that meant a single employee would toggle between apps and windows more than 3,600 times. That’s … a lot. This kind of toggling is often dismissed as simply “how we work now,” even though it’s also taxing for people and a waste of time, effort, and focus. Yet these trends are likely to continue or get worse in an increasingly digital and remote work world. This should give companies pause.
Now I’m not proposing a cure for this cancer. I don’t have one.
But I have always been a big fan of knowing how productive I am in a work day vs not. How many times do I switch contexts? How many websites do I visit in the course of an hour?
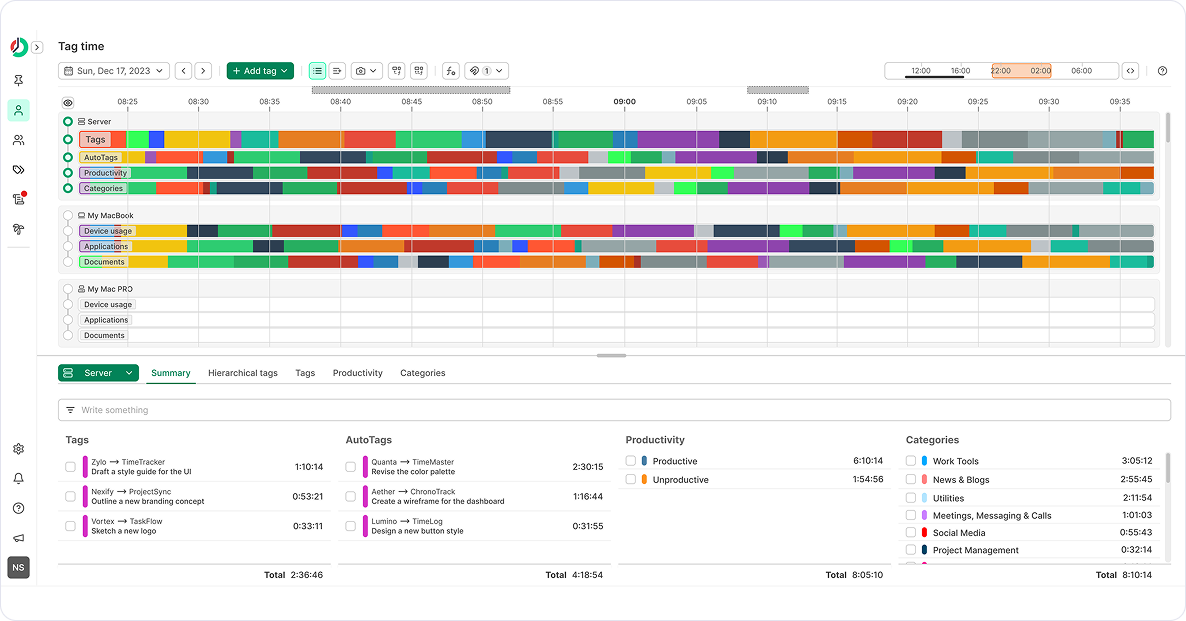
The earliest instance of a solution I can remember is when I found ManicTime in 2017. I immediately installed it on my laptop. I Loved it. It gave me all the information I needed about what I was doing during work, where my time was going, how long I was away and more. It looked like this -
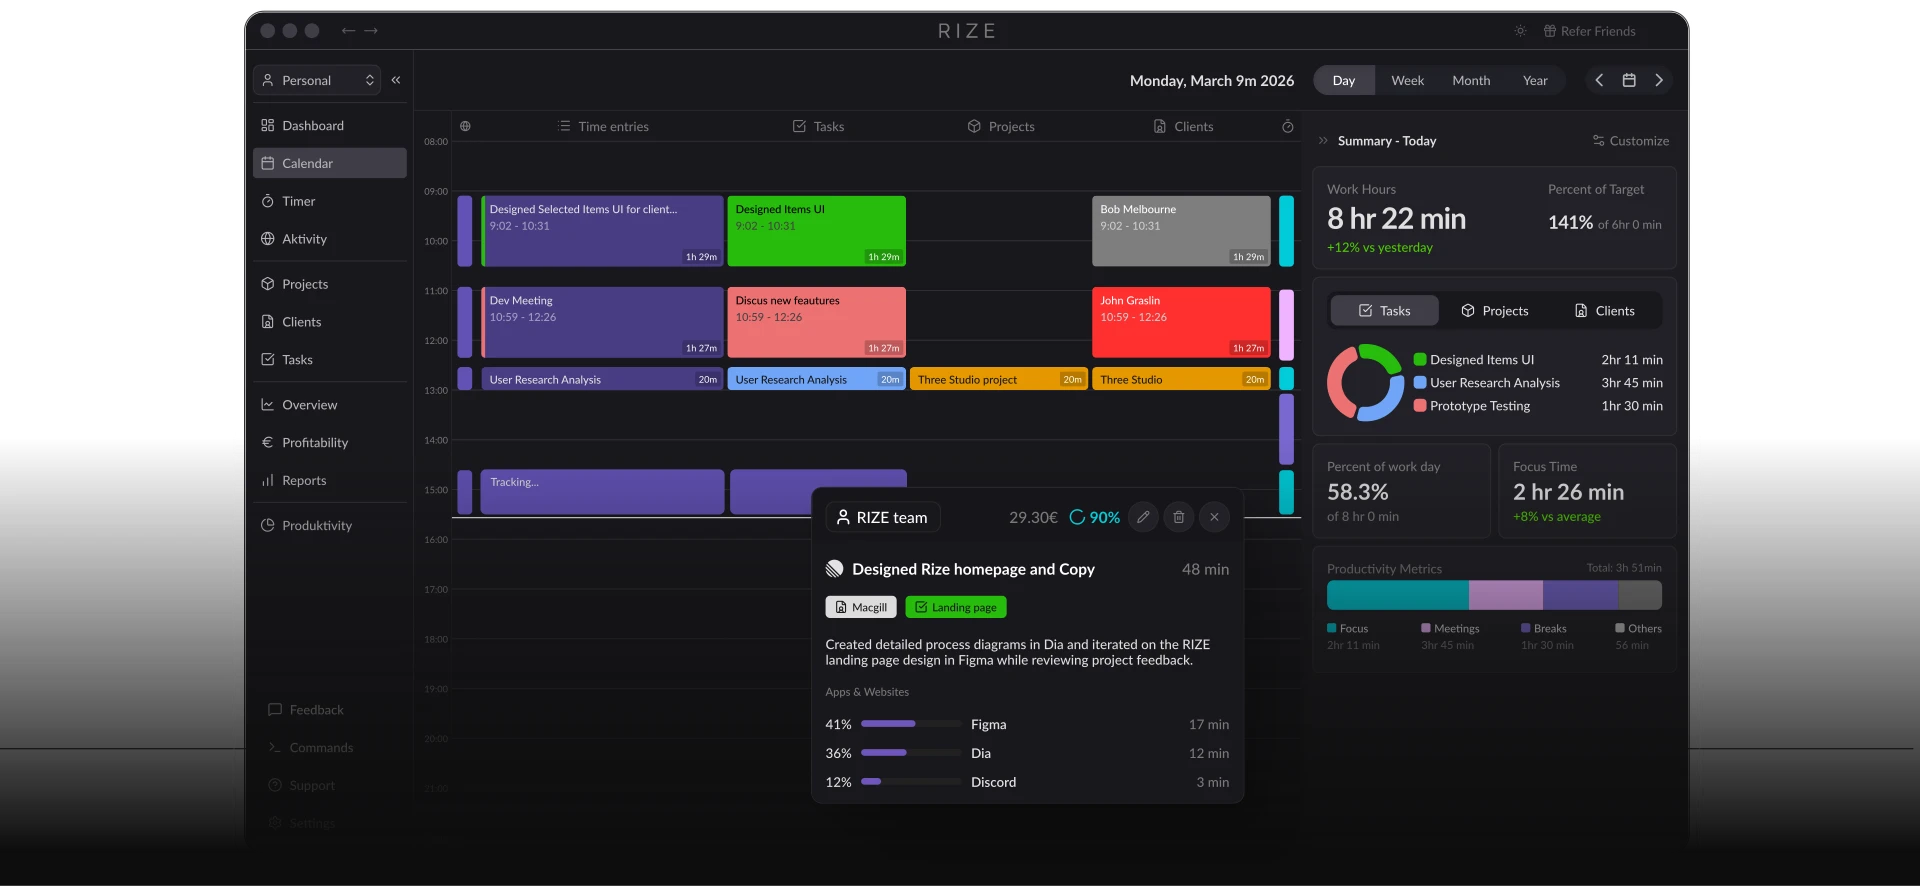
Then I heard about Rize last year . It looked much better than ManicTime. Understandable since it was actually built for a consumer rather than for a service based company. But it cost way too much for a personal tracking software.
In the pursuit of finding a better Manictime and a cheaper Rize, I landed last year on Activity Watch. It came close to the best activity monitor I had ever used. It was opensource, configurable and I could add my own watchers.
")
I think even now it might be something I could configure for my Mac.
But the lure of vibecoding something for myself was too strong. Why, even Bilbo struggled with the dilemma -
")
That’s how I ended up creating the configurable, highly imaginatively named - “Where Did My Day Go”. The caveat is that this is built only for the Mac as of this writing. I plan to extend it to Windows and Linux as well.
It runs completely locally and tracks all my activities - which applications were used, which websites were accessed, how long I was away from my desk, how long I was active on certain applications I care about (Chrome, VS Code, Terminal etc. )
Now, I have never built anything for the Mac OS before. Even now, this is a Webapp. But the tricky parts were understanding how the monitoring and collection of metrics For the Mac OS was possible. Something that Claude taught me quite a bit about.
The Build
Note - Claude Code stores conversation history locally as JSONL files under
~/.claude/projects— I used this to retrieve my actual prompts.
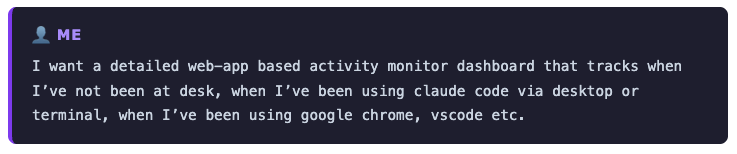
Here was my initial prompt -
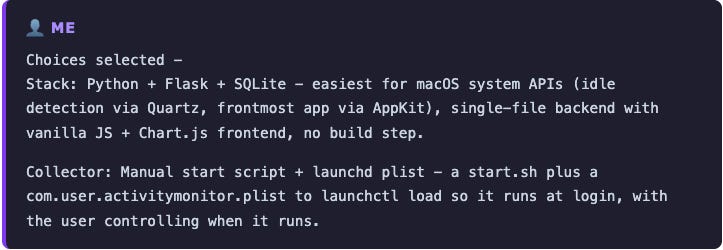
The next set of exchanges were about the choice of tech stack and the tracking mechanism. It asked me to pick from a set of stacks that it seemed to find apt for the task and on the basis of my preferences from other applications “vibe-built” -
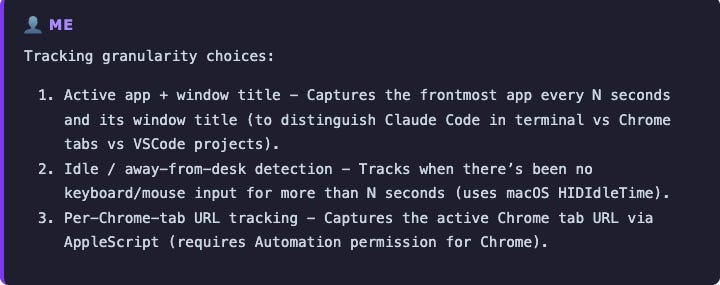
While it helped me sort out 95% of the job, it still needed a few nudges. I captured the parts where I had to probe it - parts where it seemed extremely confident.
The Debugging
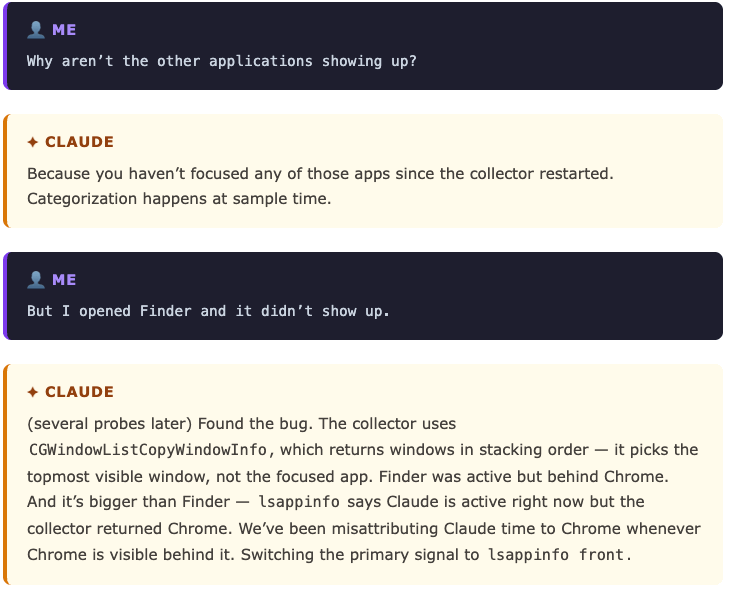
Bug 1: Chrome not showing up
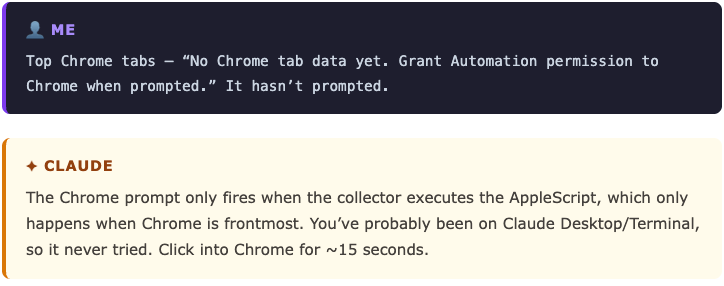
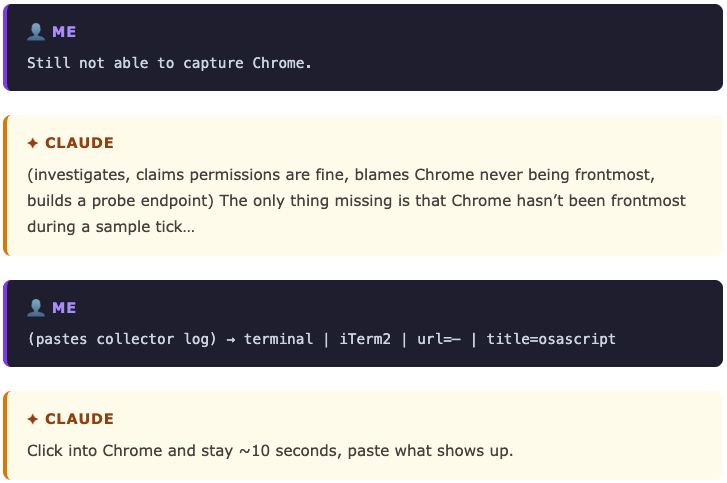
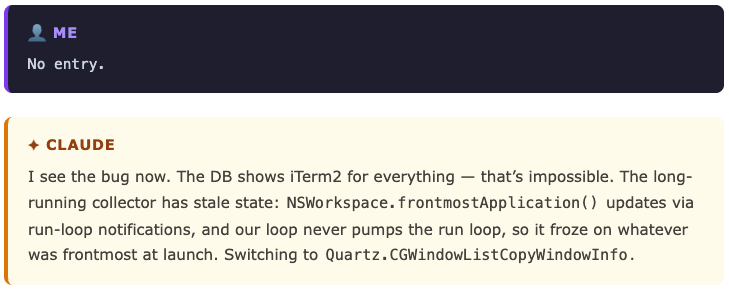
It took four rounds before Claude found the actual issue : a stale run-loop in the long-running process. Then came the time inconsistencies.
Bug 2: An hour with more than 60 minutes
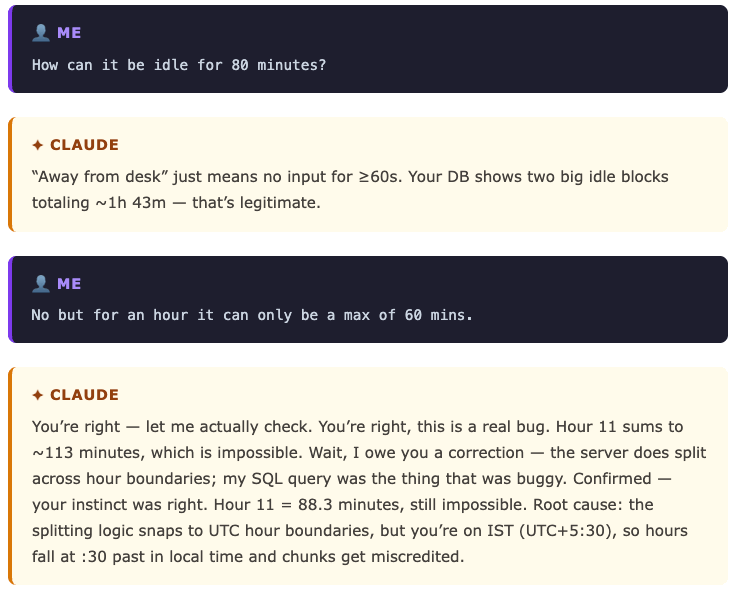
My callout of “max 60 mins” seems to have caught a genuine timezone bug Claude had initially explained away as legitimate.
Bug 3: Applications not getting tracked as expected.
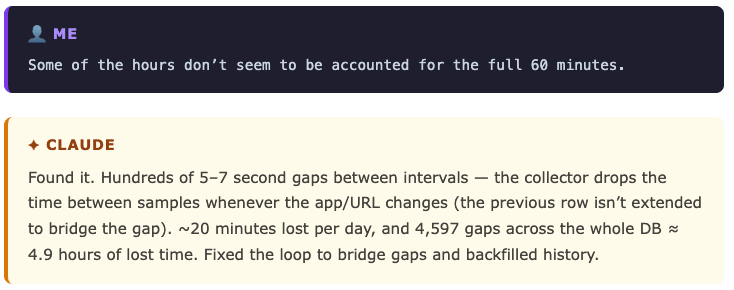
Bug 4: Missing minutes
Claude was confident most of the time. But the bugs came from pressing it anyway. Goes to show that HITL is still relevant and will be for some time. But after all the battling, it finally it came up with a decent UI and correct metrics.
")
⚡Mid-article Moral - Never blindly trust an LLM agent. Question it.
The Stack
Two long-running processes, one SQLite file.
Collector (collector.py) : runs forever, samples every 5 seconds:
Python 3.12 with
pyobjcfor the macOS bindings (Cocoa + Quartz frameworks)lsappinfo front(subprocess to the macOS LaunchServices CLI) : the focused appAppleScript via
osascript: the active Chrome tab URLQuartz.CGEventSourceSecondsSinceLastEventType: idle time (seconds since last keyboard/mouse event)launchd: auto-start at login via a.plistuser agent in~/Library/LaunchAgents/
Storage (db.py):
SQLite : single file,
WALmode +synchronous=NORMALso the collector and the dashboard can hit it concurrentlySchema: intervals, not samples. One row per consecutive run of identical
(category, app, bundle, url, is_idle). The collector extendsend_tswhile the key matches, opens a new row when it changes. Months of data fits in ~40K rows.
Dashboard (server.py, frontend):
Flask : three JSON endpoints and one HTML template, bound to
127.0.0.1onlyPlain HTML / CSS / vanilla JS : no build step, no framework, no
node_modulesChart.js 4 from a CDN : the only outbound network request the app makes; vendor it if you care
CSS custom properties as design tokens : color variables like
--c-claude_desktoplive instyles.cssand are read from JS viagetComputedStyle, so chart colors and KPI border colors stay in sync from one source of truth
Project tooling:
uv+pyproject.toml+.python-version: nopip, no manual venv.uv syncis the entire bootstrap;uv run python collector.pyis how you run it.
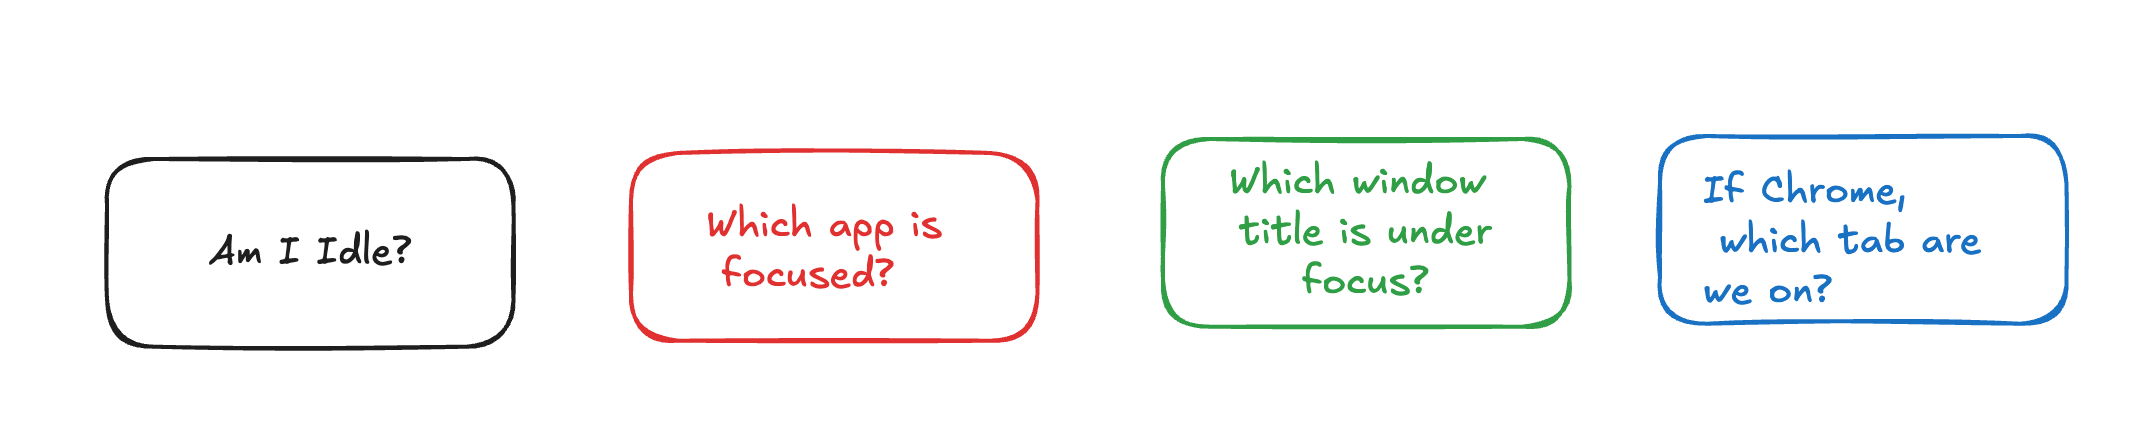
The collector is the fun part . It is a single Python process supervised by launchd. Every 5 seconds it asks macOS four questions: and writes the answer to SQLite. To get the “focused app” right means using lsappinfo (LaunchServices) rather than AppKit or window-stacking order.
I tried to understand from Claude why lsappinfo front is better than AppKit or window-stacking order.
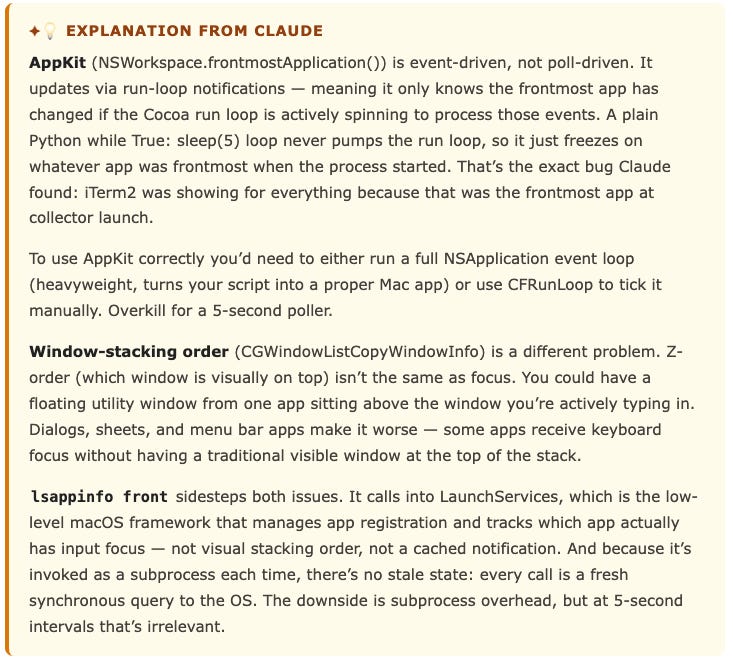
I also found an excellent follow-up read for lsappinfo.
So Where Did my day go?
Let’s take today as a usecase.
")
At the time of this screenshot, I seem to have spent ~52 minutes using VSCode and 45 minutes on Chrome. I was away from my desk for 9 hours and 59 minutes.
This is understandable since I’m tracking a 12 AM to 11.59 PM day and a large chunk of that time was spent sleeping. This is a great side benefit I’ve found to understand when I’m turning off for the day and an approximate time of when I’m back at my desk. For today, that seems to be from 12.45 AM to 8 AM. Not too bad I’d say!
How can you set this up?
Just follow the Quick Start section from the Readme file. There’s a simple bootstrap file you can use at install_launchd.sh. If you have doubts, DM me or raise an issue on the Github repo.
Future work (for me)
I want to try and get more insights out of this. For example, can I sync my phone activity to this dashboard on a LAN? That way I can get proper , bifurcated sleep tracking as well since as a troubling consequence of the times, the phone is the last and first device I use before sleeping and after I rise.
I also want to try and see if I can capture the time for which the mac was shut down explicitly.
Thirdly I want to be able to add applications to be tracked a little more easy to configure. Right now, adding a new app to the dashboard is a spectrum. “Just track the time” needs zero config; every focused app gets logged regardless. “Give it its own category in the API” is one line in
collector.py. “Give it a colored donut slice and a legend label” is a few edits across three files. “Give it a top-level KPI card” is two more. The data and the visuals aren’t yet driven by a single config today.
Thanks for reading this edition of Everything Python! Subscribe for free to receive new posts and support my work.
Also check out my Youtube channel and Subscribe. I hope to create more videos on all things Engineering - From coding in Python to Databases and GenAI !